11 Event Analytics You Need To Know
Working in the event industry requires organization and in depth-insights to stay on top of your current marketing efforts and campaign goals. Using analytics to help gain real-time insights and discover prime data helps determine you company's impact,and is the best way to stay informed and discover whether you are hitting your goals. The following 11 analytics terms are essential when working with any form of event management software, which monitors your planned events and marketing strategy.
“Our jobs as marketers are to understand how the customer wants to buy and help them to do so.” - Bryan Eisenberg
1. Attribution Report
An attribution report is a breakdown of the activities visitors engage in while on your website and also includes information about your conversions. This analytics is an excellent tool for helping you understand what actions your visitors take on the path to becoming a customer.
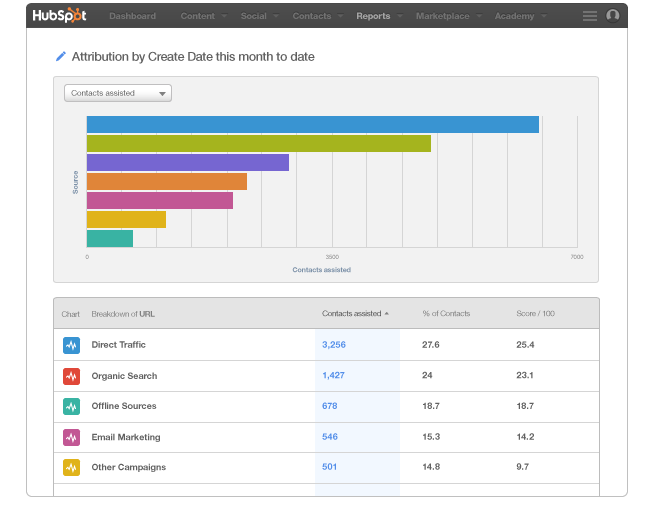
This report allows marketers to pinpoint exactly what lead to this new customer conversion. You can use this information to identify what is most effective and thus needs more money and time invested into it for improvement for increasing conversion rates.
2. Bounce Rates
Measuring bounce rates, or the amount of visitors who leave your website after seeing the first page, is critical in determining if your strategies are impacting traffic or not. Analytics tools have a feature that allows you to check your bounce rate so you can tell if you are engaging viewers appropriately or if you need to make your web page more appealing so they will want to visit the other pages and tabs on your site.
Depending on your site, there are various of ways to reduce your bounce rate and keep visitors on your site longer. It’s all about creating a layout designed to nurture your customers' needs and get them to purchase or becoming a customer in the end. This includes incorporating call-to-actions, user-friendly layouts, answering their questions upfront, providing case studies, testimonies, etc.
3. Contact-To-Customer Conversion Rate
Tracking the sales funnel, or the contact-to-conversion rate is crucial because it allows you to determine the path that each viewer takes on the way to becoming a paying customer similar to a buyers’ journey. Analyzing this data helps event planners learn what their conversion process comprises and points out what encourages each visitor to purchase from the website. From here, you can gather a percentage which allows you to track marketing strategies that are most effective and can be perfected.
Venturi Web walks you through how to calculate your conversion rates after tracking them.
“…as long as you are tracking the number of leads you get and the number of resulting sales (conversions), you can calculate your conversion rate like so…Conversion Rate = Total Number Of Sales/ Number Of Leads * 100”
Example: Let’s say you made 20 sales last year and you had 100 inquiries/ leads. Your sales to lead conversion rate would be 20%.
If you’re tracking conversions from website leads, your formula looks like so:
Conversion Rate = Total Number of Sales / Number of Unique Visitors * 100
Example: If you made 20 sales in a month and you had 2,000 unique visitors to your site, your conversion rate would be 1%.
4. Direct Traffic
Direct traffic is visitors who entered your website URL directly into a search engine, or who accessed your website or a web page via a bookmark. These are visitors who intend to directly access your brand on your business’s website to either gather information or to make a purchase. Instead of following a link to find your website or being referred to, they are visiting directly to your site with no referring websites. 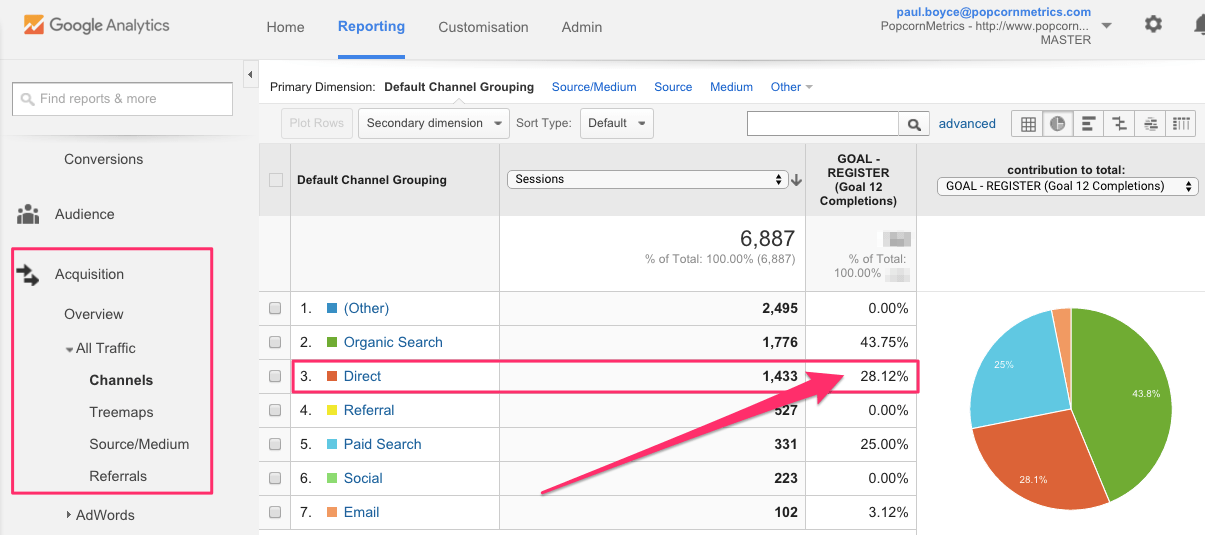
5. Distribution
Using distribution in analytics is valuable because it helps you adjust your product levels and determine if your marketing strategy is successful. This is a process where your sales results are calculated according to distribution levels of that product or sale being analyzed. Distribution-based analytics are used to help predict future sales and current market trends.
“It helps you know, not guess, what’s going on. In the past, businesses had to rely on the experience and intuition of their decision makers…Now, distributors can get data-driven information about their current and future operations”(Handshake)
In addition, it also will help you gauge future sales so you can be prepared and continue to generate more sales from current and future visitors and customers.
6. Link Referrals
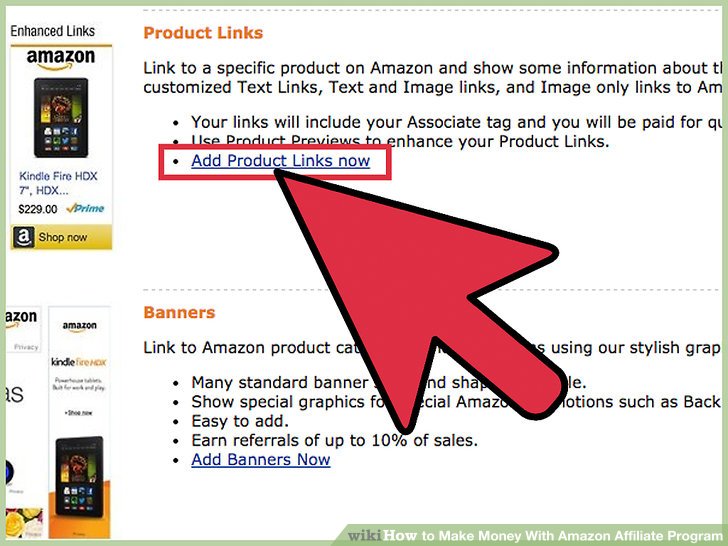 Link referrals are customers and advocates of your business or brand who share a personalized direct link to your web page. These referrals are intended to increase conversion rates with the assistance of these advocates and sometimes a brand may reward the individual or company who shares link referrals as an incentive to continue their efforts.
For example, Amazon pays customers to review their purchases through YouTube, on social media or online where they attach a direct link to that product after their review. Customers that follow that link to make a purchase are brought to amazon through these link referrals. For every link clicked, Amazon will pay you for directing possible customers to their website.
7. Method Of Sale
Using analytics to track the success of your method of sale is crucial to understanding if you are getting the best results from your options. Not every event and event planning company will use the same method of sale because each is unique and has their own approach to increasing the overall appeal of each event. Method of sales is exactly how it sounds; how your sales are made and purchased. Through this tool, you can access the most popular to least favored methods of sale to use for future events and make purchasing even easier for guests.
Below are a few examples of methods of sales:
Online Sales (credit cards, PayPal, website, etc.)
Offline Sales (drop by, live auction, box-office, retail, etc.)
8. Revenue Report
Revenue reports allow you to view your total sales transaction for a given period. This is a great tool for helping you see daily, weekly, and monthly sales figures, assessing your income and tracking your revenue goals as you go so you can determine whether your current strategy is successful or should be altered.
This report is your way of evaluating the financial position of your company or event.
9. Source
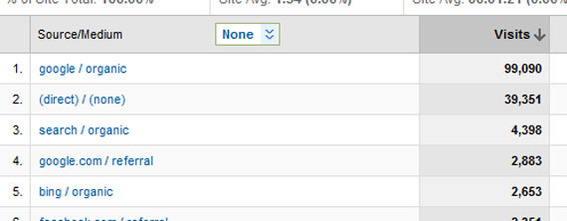
The term “source” refers to where you are generating traffic to your site. This can be a search engine (Google), another website, organic searches, CTA, link referrals or blogs; this is the origin of your traffic. Knowing the source and tracking it through analytics will outline where your efforts are the most successful so you can mimic the strategy and concentrate on keeping up your approach in these areas.
10. Touchpoints
A touchpoint can refer to the initial point of contact with any visitor or potential customer and can outline that journey even after they become a paying customer. For example, if a customer finds your business through a social media ad, reads reviews, checks out your blog, these are all touchpoints; anytime a potential customer comes in contact with your brand. That is why it’s important to identify all your touchpoints and perfect them so your customers are satisfied and nurtured into becoming a customer.
11. Tracking URL
If you are using a pay per click advertising strategy, then using a tracking URL will help you understand where you are generating your link clicks from. That is just one example for when you would want to do tracking URLS. Tracking your links helps you measure the effectiveness of your marketing and how many people are taking the bait and clicking on your different CTA and ads.
Anyone who is working within the event planning industry should become familiar with these 11 event analytics to help gauge performance and improve their marketing strategy for each endeavor. The more information you have related to these areas, the more successful you will be in the long term. For more useful information about event planning and marketing efforts, you can subscribe to our blog below.


